Quality Control in manufacturing involves the use of multiple tools that go hand in hand with the different methodologies we discussed above. These tools play a fundamental role in helping production engineers realize their quality control goals.
- Control Chart
Control charts are Statistical Process Control (SPC) tools that help monitor variance in the production process over time. These charts help in the identification of trends, shifts in these trends, or any unusual deviation in the production process.
The most common types of quality control examples charts include X-bar, R-chart, and P-charts.
- Check Sheet
Check sheets are a generic tool for quality control in manufacturing that helps ensure compliance with standard procedures and standards. They are an easy-to-read visual log of production activities, making them a great resource of preliminary data for creating histograms and other visual aids for decision-making in quality control. - Cause and Effect Diagram
Cause and effect diagrams (Ishikawa or fishbone diagrams) are quality control tools useful in evaluating the basic factors (or causes) leading to a production defect (of effect).
Mapping all the possible sources of a recurring problem makes it simpler to establish causality and focus on only the most probable causes.
- Histogram
A histogram is a graphical representation of the frequency distribution of variables in a data set. While seemingly a very simple diagram, it is a powerful tool for quality control in manufacturing as it allows to quickly interpret the gross patterns and variation in their production data. - Pareto Chart
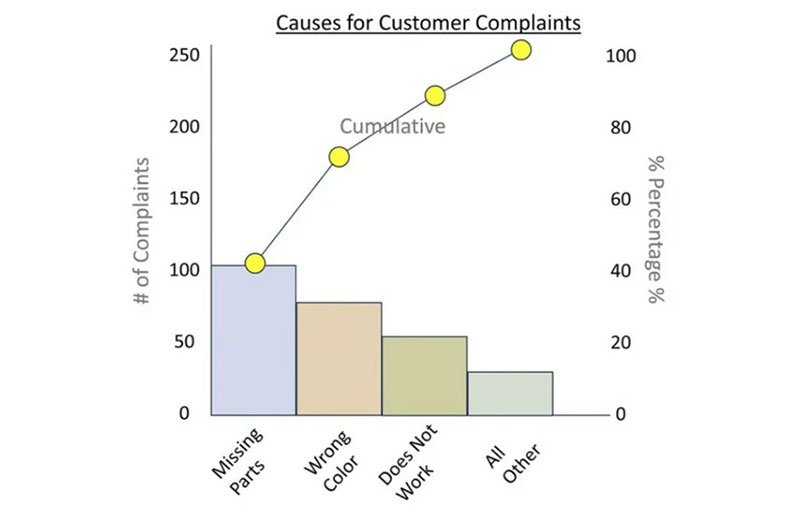
Pareto charts are based on the classic 80/20 rule, which states that 80% of consequences come from just 20% of the causes. A Pareto chart uses bar and line graphs to highlight the most significant causes of production problems, guiding engineers to focus their efforts on areas that matter the most.
- Scatter Diagram
Scatter diagrams express the correlation between two variables in a comprehensible way. It is easy to identify inherent trends, outliers, and irregularities in production floor data by looking at a scatter diagram.
In addition, for quality control in manufacturing, scatter diagrams are helpful in identifying cause-and-effect relationships.
- Stratification
Stratification analysis is a technique that sorts data into separate categories based on some predefined criteria. It can help in identifying hidden trends in manufacturing data and catch flaws that are not easily visible through visual aids like histograms or scatter diagrams.